Performance
coming soon...
● タンパク質間ドッキング予測精度
ZLAB docking benchmark 4.0 (
Mintseris et al., Proteins 2010) を用いたタンパク質ドッキングの精度 (Success Rate) を示します.Success Rateは,横軸に候補構造の出力数 \(N\) をとり,ドッキング予測で上位 \(N\) 位以内に正解構造に近い構造 (near native) が存在した場合にその複合体の予測に成功 (Success) したとし,成功した複合体の割合を176個の複合体で求めたものです.正解構造に近い構造 (near native) の基準は,\( \mbox{Ligand-RMSD}< 5 \mathrm{\unicode{x212B}} \) としています.\(\mbox{Ligand-RMSD}\)はレセプタータンパク質(
-Rオプションで指定したPDB) を重ね合わせたときのリガンドタンパク質のRMSD値として求められます.Success RateはZDOCK 2.3 (
Chen et al., Proteins, 52(1): 2003.) および,ZDOCK 3.0 (
Mintseris et al., Proteins, 69(3): 2007.) と比較をしました.
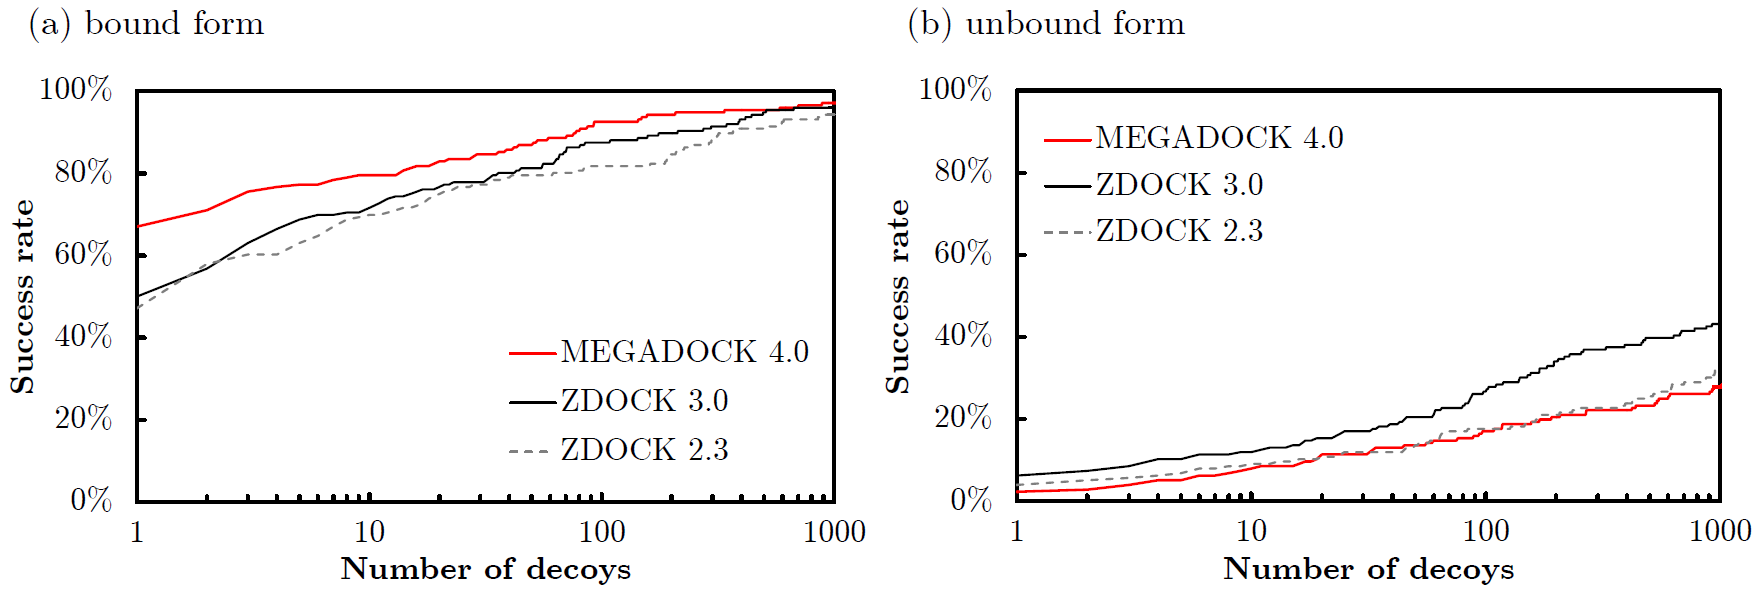
図:ZLAB docking benchmark 4.0の176複合体のドッキング予測精度.
● タンパク質ドッキング予測の計算時間(1 CPUコア)
ZLAB Docking Benchmark 4.0の352 (bound/unbound 両方) 複合体のドッキング計算にかかったトータルの時間と1ペアの平均計算時間を以下の表に示しま
す.計算にはMEGADOCK, ZDOCKともにIntel Xeon X5670 CPU (Westmere-EP, 2.93GHz, 6 cores) の1コアを使用しています.MEGADOCK 4.0のバイナリ
megadockとFFTW3ライブラリはIntel C++ Compiler version 14.0.2.144を用いてコンパイルしています.
表:ZLAB Docking Benchmark 4.0 (352複合体) の計算時間
|
|
MEGADOCK 4.0
|
ZDOCK 2.3
|
ZDOCK 3.0
|
|
Total (352 docking) time (hour)
|
67.1
|
309.2
|
684.3
|
|
Averaged (1 docking) time (min)
|
11.4
|
52.7
|
116.6
|
|
Speedup from ZDOCK 3.0
|
10.20
|
2.21
|
(1.0)
|
● GPUを用いたときの計算時間
MEGADOCK 4.0でGPUを用いた時の計算時間を示します.使用したバイナリ
megadock-gpuはCUDA 6.0とIntel C++ Compiler version 14.0.2.144を用いてコンパイルしています.計算にはIntel Xeon X5670 CPU (Westmere-EP, 2.93GHz, 6 cores) を2ソケット (12 CPU cores), およびNVIDIA Tesla K20X (GK110) GPUを3枚搭載したノードを用いています.
表:ZLAB Docking Benchmark 4.0 (352複合体) の計算時間.12CPUコア利用時は,24スレッド指定(hyper threading)を使用しています.
|
|
1 CPU core
|
12 CPU cores
|
12 CPU cores & 1 GPU
|
12 CPU cores & 3 GPUs
|
|
Total (352 docking) time (hour)
|
67.1
|
8.20
|
2.26
|
1.02
|
|
Averaged (1 docking) time (min)
|
11.44
|
1.40
|
0.39
|
0.17
|
|
Speedup from 1 CPU core
|
(1.0)
|
8.1
|
29.7
|
65.8
|
● GPUスーパーコンピュータを用いたときの計算時間
MEGADOCK 4.0でGPUスーパーコンピュータを用いた時の計算時間と並列化効率を示します.使用したバイナリ
megadock-gpu-dpはCUDA 6.0とIntel C++ Compiler version 14.0.2.144, OpenMPI version 1.6.5を用いてコンパイルしています.計算には東京工業大学 学術国際情報センターのTSUBAME 2.5
のThinノードを用いています.Thinノードは2ソケットのIntel Xeon X5670 CPU (2.93GHz, 6 cores) と3枚のNVIDIA Tesla K20X (GK110) GPUを搭載しています.ハードウェアの詳細に関しては
東京工業大学 学術国際情報センターのHPをご覧ください.
表:ノード並列時の計算時間と並列化効率(強スケーリング).計算時間はZLAB Benchmarkの176複合体のbound/unboundの両方を全て計算した352回の計算の積算です.
|
#Nodes \(n\)
|
35
|
70
|
105
|
140
|
210
|
280
|
350
|
420
|
|
#CPU cores
|
420
|
840
|
1,260
|
1,680
|
2,520
|
3,360
|
4,200
|
5,040
|
|
#GPUs
|
105
|
210
|
315
|
420
|
630
|
840
|
1,050
|
1,260
|
|
Time \(T_n\) (min)
|
264.4
|
133.3
|
90.6
|
67.4
|
44.6
|
33.1
|
26.7
|
22.5
|
|
\(\mbox{Strong Scaling}_n\)*
|
-
|
0.991
|
0.973
|
0.981
|
0.988
|
0.997
|
0.990
|
0.980
|
| * \(\mbox{Strong Scaling}_n = (T_{35}/T_n) / (n / 35)\) |
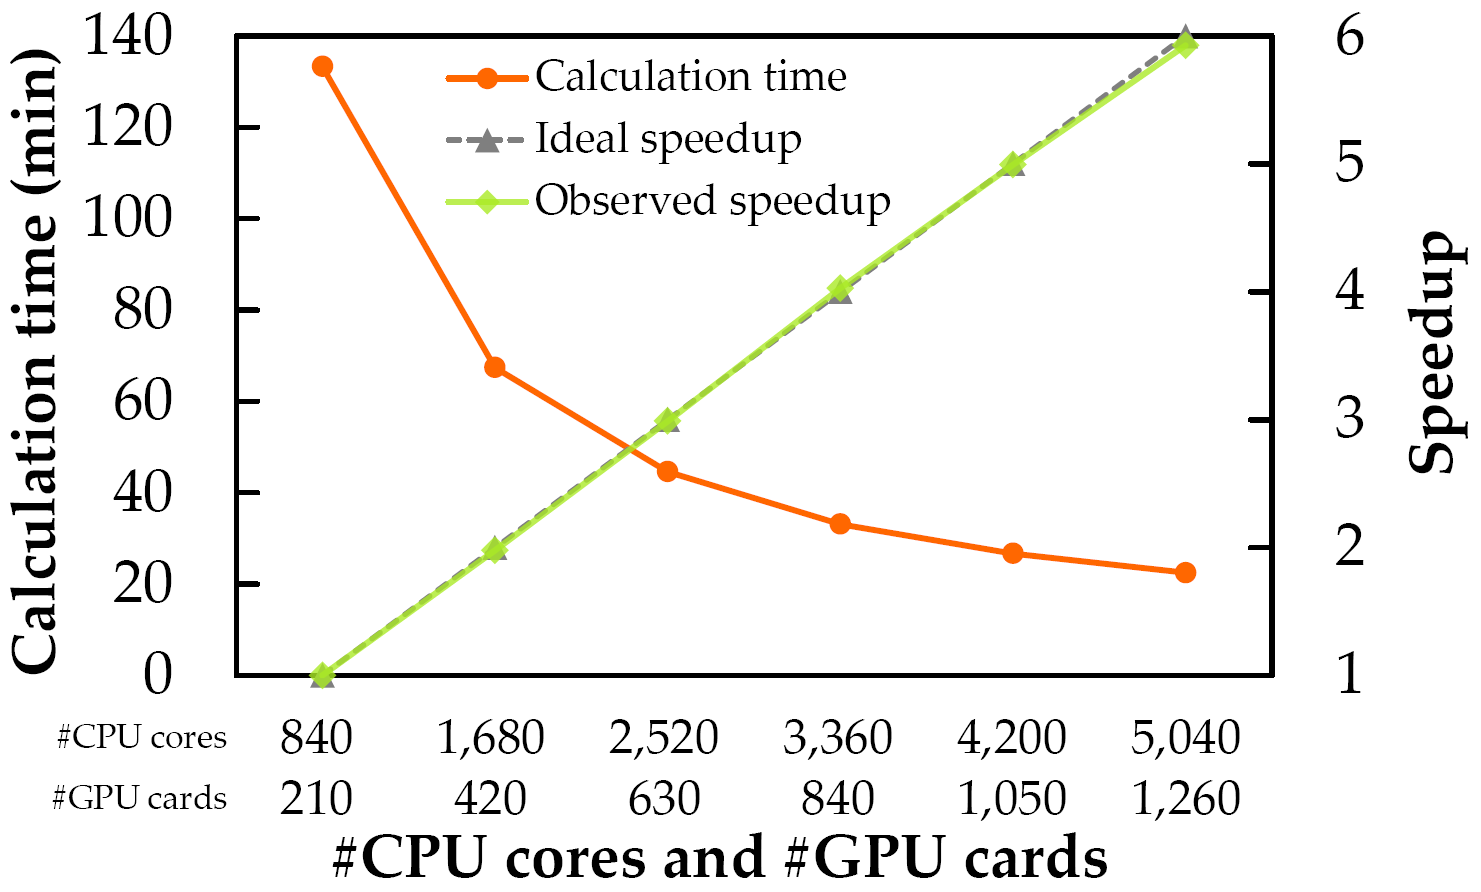
図:ノード並列時の計算時間と並列化効率(強スケーリング)
● MEGADOCKのドッキングスコア関数
One of the major docking methods is the 3-D grid-based docking technique with the fast Fourier transform (FFT) correlation approach (
Katchalski-Katzir et al., Proc Natl Acad Sci USA, 89(6): 1992.). In this method, also used on MEGADOCK 4.0, the protein structure is projected onto a 3-D grid, and the scoring function is calculated by discrete Fourier transform (DFT) and inverse discrete Fourier transform (IDFT) using the correlation of two discrete functions (protein grids), as follows:
\begin{align*}
S(\alpha, \beta, \gamma) &= \sum_{l=1}^N \sum_{m=1}^N \sum_{n=1}^N R(l,m,n)L(l+\alpha, m+\beta, n+\gamma)\\
&= \mathrm{IDFT}[\mathrm{DFT}[R(l,m,n)]^* \mathrm{DFT}[L(l,m,n)]]
\end{align*}
where \(R\) and \(L\) are the discrete function of the receptor (\(R\)) and ligand (\(L\)) proteins, respectively, \((l, m, n)\) is a coordinate in the 3-D grid space, and \((\alpha, \beta, \gamma)\) is the parallel translation vector of the ligand protein. The asterisk operator \(*\) indicates the complex conjugate of a complex number. To directly execute the simple convolution sums in \(S(\alpha, \beta, \gamma)\), \(\mathcal{O}(N^6)\) calculations are required; however, this is reduced to \(\mathcal{O}(N^3 \log N)\) using the FFT.
The discrete functions R and L usually take into account multiple effects, such as shape complementarity, electrostatic interaction, desolvation free energy, and so on (e.g. ZDOCK (
Pierce et al., PLOS ONE, 6(9): 2011.), PIPER (
Kozakov et al., Proteins, 65(2): 2006.), and SDOCK (
Zhang et al., J Comput Chem, 32(12): 2011.)). The total scoring function is the weighted sum of the partial scoring functions, according to the following example:
\begin{align*}
S_{\mathrm{total}}&= w_{\mathrm{shape}}S_{\mathrm{shape}}+w_{\mathrm{elec}}S_{\mathrm{elec}}+w_{\mathrm{desol}}S_{\mathrm{desol}}\\
S_{\mathrm{shape}}&= \mathrm{IDFT}[\mathrm{DFT}[R_{\mathrm{shape}}(l,m,n)]^* \mathrm{DFT}[L_{\mathrm{shape}}(l,m,n)]]\\
S_{\mathrm{elec}}&= \mathrm{IDFT}[\mathrm{DFT}[R_{\mathrm{elec}}(l,m,n)]^* \mathrm{DFT}[L_{\mathrm{elec}}(l,m,n)]]\\
S_{\mathrm{desol}}&= \mathrm{IDFT}[\mathrm{DFT}[R_{\mathrm{desol}}(l,m,n)]^* \mathrm{DFT}[L_{\mathrm{desol}}(l,m,n)]]
\end{align*}
In this example, the total scoring function is calculated based on three correlation functions.
(In actuality, the desolvation free energy function \(S_{\mathrm{desol}}\) also often comprises multiple correlation functions, e.g., ZDOCK uses six correlation functions and PIPER uses nine correlation functions for the calculation of \(S_{\mathrm{desol}}\).)
On the other hand, MEGADOCK requires only one correlation function, despite that the total scoring function take into account shape complementarity, electrostatic interaction, and desolvation free energy, like ZDOCK. We developed the original shape complementarity function (\(S_{\mathrm{rPSC}}\)) and desolvation free energy function (\(S_{\mathrm{RDE}}\)). The total scoring function of MEGADOCK is represented by these functions as follows:
\begin{align*}
S_{\mathrm{total}}&= \Re \left[\mathrm{IDFT}[\mathrm{DFT}[R(l,m,n)]^* \mathrm{DFT}[L(l,m,n)]] \right]\\
R(l,m,n) &= R_{\mathrm{rPSC}}(l,m,n) + w_{\mathrm{RDE}}R_{\mathrm{RDE}}(l,m,n) + iR_{\mathrm{elec}}(l,m,n)\\
L(l,m,n) &= L_{\mathrm{rPSC\&RDE}}(l,m,n) -iw_{\mathrm{elec}} L_{\mathrm{elec}}(l,m,n)
\end{align*}
where \(S_{\mathrm{total}}\) consisted of only one correlation function. More details of the partial functions are described in previous reports (
Ohue et al., Lecture Notes Comput Sci, 7632: 2012.;
Ohue, Ph.D. Thesis, Tokyo Institute of Technology, 2014.).
References
- MEGADOCK docking functions (rPSC shape complementarity)
Ohue M, et al., MEGADOCK: An all-to-all protein-protein interaction prediction system using tertiary structure data, Protein Pept Lett, 21(8): 766-778, 2014.
- MEGADOCK docking function (RDE desolvation free energy)
Ohue M, et al., Improvement of the Protein-Protein Docking Prediction by Introducing a Simple Hydrophobic Interaction Model:
an Application to Interaction Pathway Analysis, Lecture Notes in Comput Sci, 7632: 178-187, 2012.
- MEGADOCK for CPU supercomputer (MEGADOCK 3.0/MEGADOCK-K)
Matsuzaki Y, et al., MEGADOCK 3.0: A high-performance protein-protein interaction prediction software using hybrid parallel computing for petascale supercomputing environments, Source Code for Biol Med, 8(1): 18, 2013.
- MEGADOCK-GPU
Shimoda T, et al., MEGADOCK-GPU: Acceleration of Protein-Protein Docking Calculation on GPUs, In Proc of ACM-BCB 2013, 884-890, 2013.
- MEGADOCK for GPU supercomputer (MEGADOCK 4.0)
Ohue M, et al., MEGADOCK 4.0: an ultra–high-performance protein–protein docking software for heterogeneous supercomputers, Bioinformatics, 30(22): 3281-3283, 2014.
- MEGADOCK for Xeon Phi
Shimoda T, et al., Protein-Protein Docking on Hardware Accelerators: Comparison of GPU and MIC Architectures, BMC Systems Biology, 9(Suppl 1): S6, 2015.
 Copyright © 2014-2019 Akiyama Laboratory, Tokyo Institute of Technology, All Rights Reserved.