The K indicator epidemic model follows the Gompertz curve
Yutaka Akiyama* (*Email: akiyama(at)c.titech.ac.jp)
Department of Computer Science, School of Computing, Tokyo Institute of Technology
W8-76 2-12-1 Ookayama, Meguro-ku, Tokyo 152-8550, Japan
Abstract
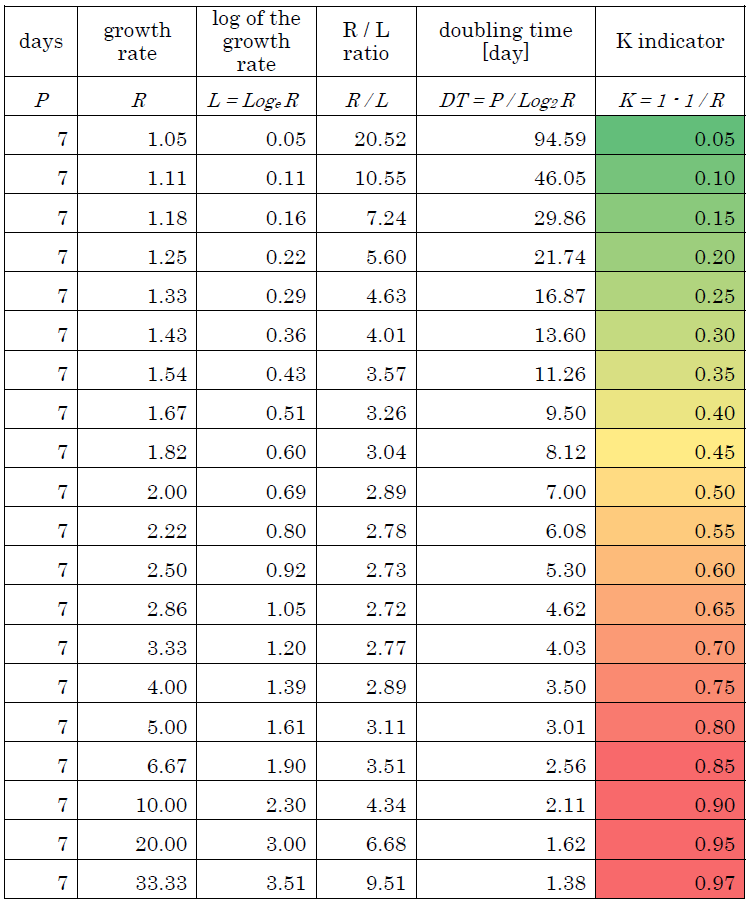
Nakano and Ikeda have proposed a novel indicator called "K" to represent a growth status in COVID-19 spread. The K indicator was proposed for predicting the convergence of the epidemic and early detecting of phase changes in the trend of infection. They not only proposed the simple indicator itself, but also presented a background model on the temporal change of the K value against COVID-19 epidemic. In this paper, we analyzed the mathematical properties of the K indicator with their temporal change model, and proved that the model is essentially identical to the Gompertz curve which is described by a double-exponential function. In addition, we showed the relationships between the K indicator and other closely related indicators such as "growth rate", "logarithm of the growth rate", and "doubling time". Nakano and Ikeda derived, by fitting the real data, an empirical equation k = 1+2.88K', which binds the internal model parameter k with the time derivative (K') of the K indicator. Here we derive the same equation analytically. The purpose of this paper is not to follow and evaluate the whole work by Nakano and Ikeda, but to clarify mathematical nature of the K indicator. Thus, their excellent applications, i.e. investigation of the differences in epidemic trends between countries based on the decay pace of the K indicator, and the estimation of the number of independent waves of the epidemic in the United States and Japan, for example, are out of scope of this paper. This manuscript is a direct English translation from our previous work, but some notes are newly added on the relationship with the Gompertz curve.
-
The K indicator epidemic model follows the Gompertz curve
(pdf, version 1.1, 16 June, 2020) -
Supplemental Data 1:
The time transition of several values with different model parameters k
(.xlsx file)
Table 1 The relationship between the growth rate R, the logarithm of the growth rate L, the R/L ratio, the doubling time DT, and the K indicator K
